Are you trying to get more people to discover your services or buy through your website? Are you spending money and/or time on online marketing to get more people to your website? Then let me let you in on a little secret, Google Analytics can be your small business superpower! Plus, it’s FREE!
I say ‘secret’ and ‘superpower’ because to be honest with you, many small business owners don’t utilise this free Google tool. And I know exactly why. It’s daunting! Google Analytics holds so much data and uses plenty of technical jargon, which makes it really hard to understand. Especially when you’re a small business owner and are already juggling the many hats involved (trust me, I know!).
Therefore after a bit of research through my Instagram account and from working with small business owners on a daily basis, I wanted to share some of my favourite Google Analytics tips with you. Once you have Google Analytics set up correctly it can 100% be (one of your many) small business superpowers.
A Goal in Google Analytics is a key interaction with your website which you are tracking. This may be when someone makes a purchase, submits a form, clicks on your phone number or email address, etc.
How Google Analytics can help you improve
I was asked the question on Instagram – ‘how am I supposed to use Google Analytics to improve my website’. I have good news for you, you can use Google Analytics to not only improve your website but your bottom line too! Here’s how:
Learn what your most important traffic channels are
When I say ‘traffic channel’ I am meaning, where your website visitors and converters (people who complete a Goal) are coming from. It might be from Google (organic search or paid search if you are doing Google Ads or Microsoft Advertising for example), from social media, from other websites (referral) or maybe from email if you are sending out email blasts. When you understand which channels send the most visitors and converters you can then hone your website marketing strategy to focus your time/money on getting the most from these channels
Learn how people are viewing your website
More and more people are searching the web via small screens, like mobile phones. Through Google Analytics you can see the percentage of visitors on desktop vs. mobile vs tablets. Say the majority of your website visitors are viewing your website on a mobile device however you get very few sales/enquires from people on mobiles. Then it may be time to look into if there is some kind of roadblock for people trying to convert on mobiles?
See what organic search keywords people are typing in to find your website
Over the years Google has given us less and less data in regards to what keywords drive organic traffic to website to protect user privacy. Which is why you may see (not provided) when you look at the keywords report in Google Analytics. Here is Google’s announcement from back in 2011.
The best way to analyse what keywords are driving organic traffic to your website is through Google Search Console data. By simply linking this account to your Google Analytics account you can get this data right in your dashboard.
Read: My top 5 tips for getting the most from Google Search Console here »
Improve content and create new content based on what’s popular
Within Google Analytics you can also find out what are the most popular pages on your website. From viewing this type of data you can then ensure that your most popular pages are full of useful, up to date content and function well. Plus you can also use this data to create new content around similar topics which people may enjoy.
Pro tip: You can also use Google Analytics to see what pages people view before converting (buying/enquiring) on your website. If you notice a pattern, then you may want to look at how you can get more people to those pre-conversion pages as obiously they have a little something special that enocourages people to buy/enquire.
So those are just some of the many things Google Analytics can help you see. The question is, how do you find this data? Here are some of my favourite Google Analytics reports and how to find them:
The Google Analytics reports you should pay attention to
Let’s start with the report I check on the most for my own websites and my clients:
Acquisition Channels Report
Where to find it: Acquisition > All Traffic > Channels
I love this report because you can get a good bird’s eye view of where your website traffic is coming from alongside your converters and/or revenue (if you are an eCommerce business).
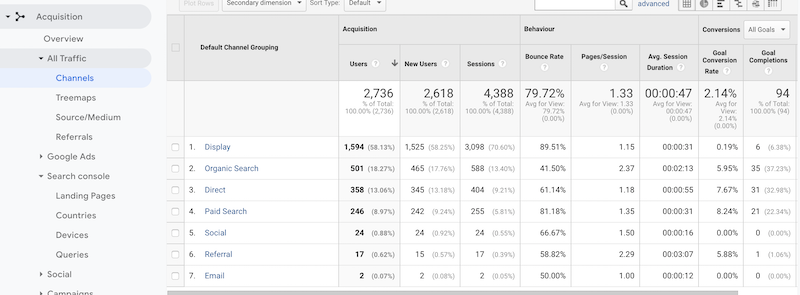
Users refers to unique visits, while ‘Sessions’ refers to total visits, e.g. 1 User could visit a website 3 times in a day and that would be counted as 1 User and 3 Sessions.
From the above report, I can tell that this website gets a lot of traffic from ‘Display’ (these are Display Ads run through Google Ads) though the goal conversion rate is quite low. That’s where I’d come in and go, why? For this specific example, we are running Display Ads for branding, so our aim is to get eyeballs on my clients brand and if we get conversions, that’s an added bonus. As Display Ads are very cheap to run for this client, the investment is working well.
There is a lot more we could talk about regarding this report. Therefore I highly recommend you take the time to get to know it well. Make sure you hover over the little circles with question marks beside each of the column headers to learn more.
If you want to delve a bit deeper and see for instance what social network is sending the most visitors/converters to your site, you can navigate to Acquisition > All Traffic > Source / Medium for a much more granular look:
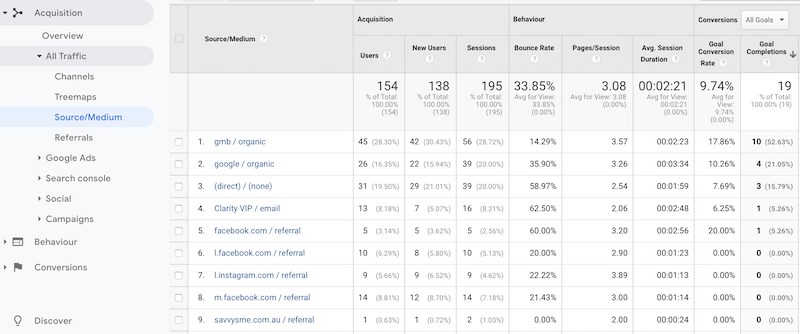
The top one gmb / organic is one I manually set up for my clients Google My Business listings, so we can see exactly how much traffic and conversions this listing sends to my client’s websites. As you can see for this client, and for many of my clients, having this data is so valuable.
Going off the above, I would say the effort my client is putting into their SEO, is definitely paying off.
Mobile Overview Report
Where to find it: Audience > Mobile > Overview
In this report, you can clearly see what device your website visitors and converters are on. If a large portion of your website visitors are on mobile devices, it might be time to schedule in regular checks on your mobile website.
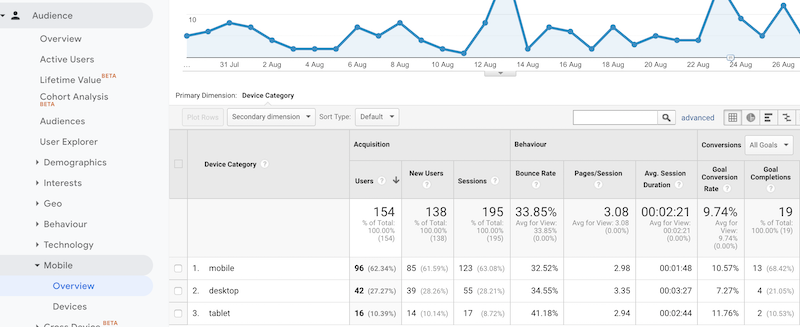
From the above, we can see that over 62% of this business’s website visitors are on mobile. And even more important, over 68% of converters are on mobile. Therefore is there anything we can do to improve the mobile website and experience so that we can improve that goal conversion rate and get more enquiries?
Search Console Queries Report
Where to find it: Acquisition > Search Console > Queries
I love this report because it can give you an insight into how your SEO efforts are doing. Once you have connected your Google Search Console account you will start to see the types of keywords people are typing into Google to find your website.
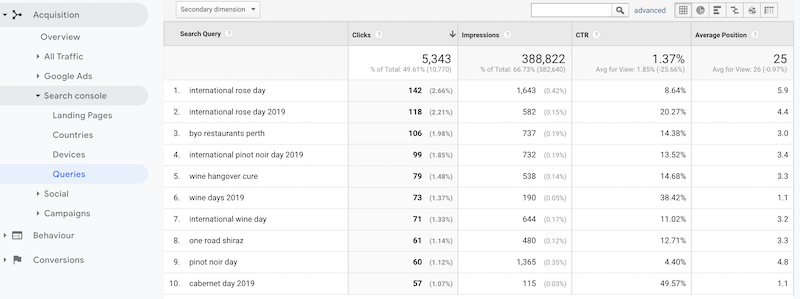
From this report, you can work on SEO strategies to improve your average position and CTR in order to get more people to your website.
Landing Pages Report
Where to find it: Behaviour > Site Content > Landing Pages
I typically view both the All Pages report and the Landing Pages report (also under the same section). The All Pages report shows you how many page views you get for each page, while the Laning Pages report shows you your top landing pages. A landing page is the page someone enters your site. Therefore it’s the first point of contact.
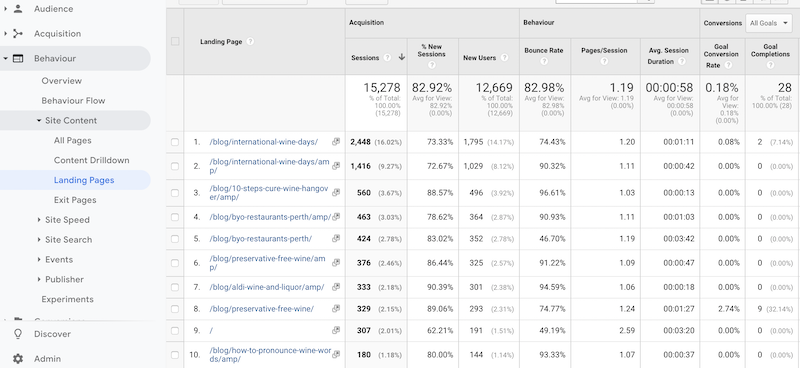
From this report, you can see your most important pages. If a lot of people are viewing a specific page, it’s important that the page is kept up to date and is useful to the user. You can also use this report to create more content ideas around what’s popular.
The above reports only brush the surface of what you can learn about your website visitors and converters. My best advice when it comes to Google Analytics is to take the time to learn about it and get to know it. You don’t have to understand every single report, just the ones that matter to your business.
Google Analytics has plenty of free resources to help you learn more over at the Google Analytics Academy.
I also offer one on one, or group training sessions either in person or online via video chat to help you understand your data better. Please get in touch if you’d like to learn more.

